
Cardiac Motion Visualization
The analysis of myocardial function is important for the diagnosis of heart diseases, the planning of therapy and the understanding of the effect of cardiac drugs on regional function. Many cardiac disorders result in regionally altered myocardial mechanics. Traditionally, an abnormal contractile function of ventricles is determined by measuring the wall thickening using MRI, Echocardiography and SPECT. Because abnormalities in myocardial strain are detectable before first symptoms of a heart attack, we want to establish a finite element mesh based on time-series imaging data.
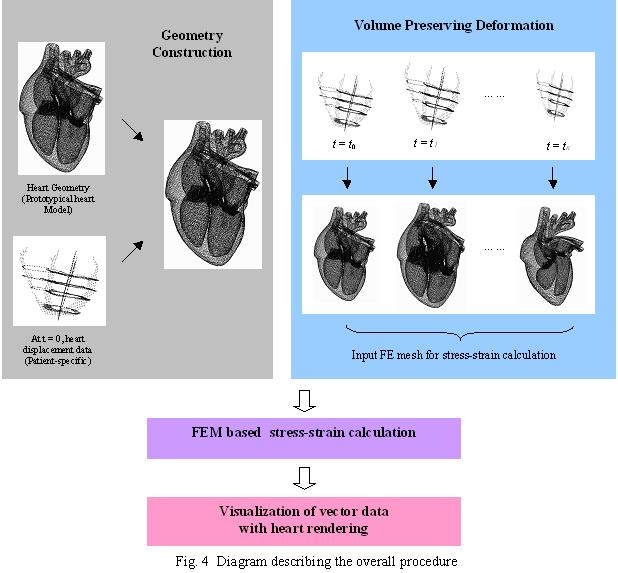
This finite element mesh, enables us to calculate the deformation gradient and all the mathematical derivables, such as volume and strain tensor, of the left ventricle. Strain vectors at each vertex point are visualized in order for users to understand the major direction and amount of strain. Since there are many individual vectors to be shown over a time period, it could be hard for users to explore a pattern of major direction and its magnitude, if interrelation between the vector data is not carefully shown. For example, drawing changing arrows representing the vector information at each vertex over time, may be one way to show. However, because the deformation will also be animated at the same time, it could be visually inconsistent over time resulting in clutter visualization. Streamline interconnecting the individual vertices can provide where the major strains are and what their directions are. Scholar information can be encoded into color information and then can be mapped into the surface colors.